In previous article, we discussed about supervised learning, where model learn from labeled data. We categorized supervised learning into two main categories which are regression and classification.
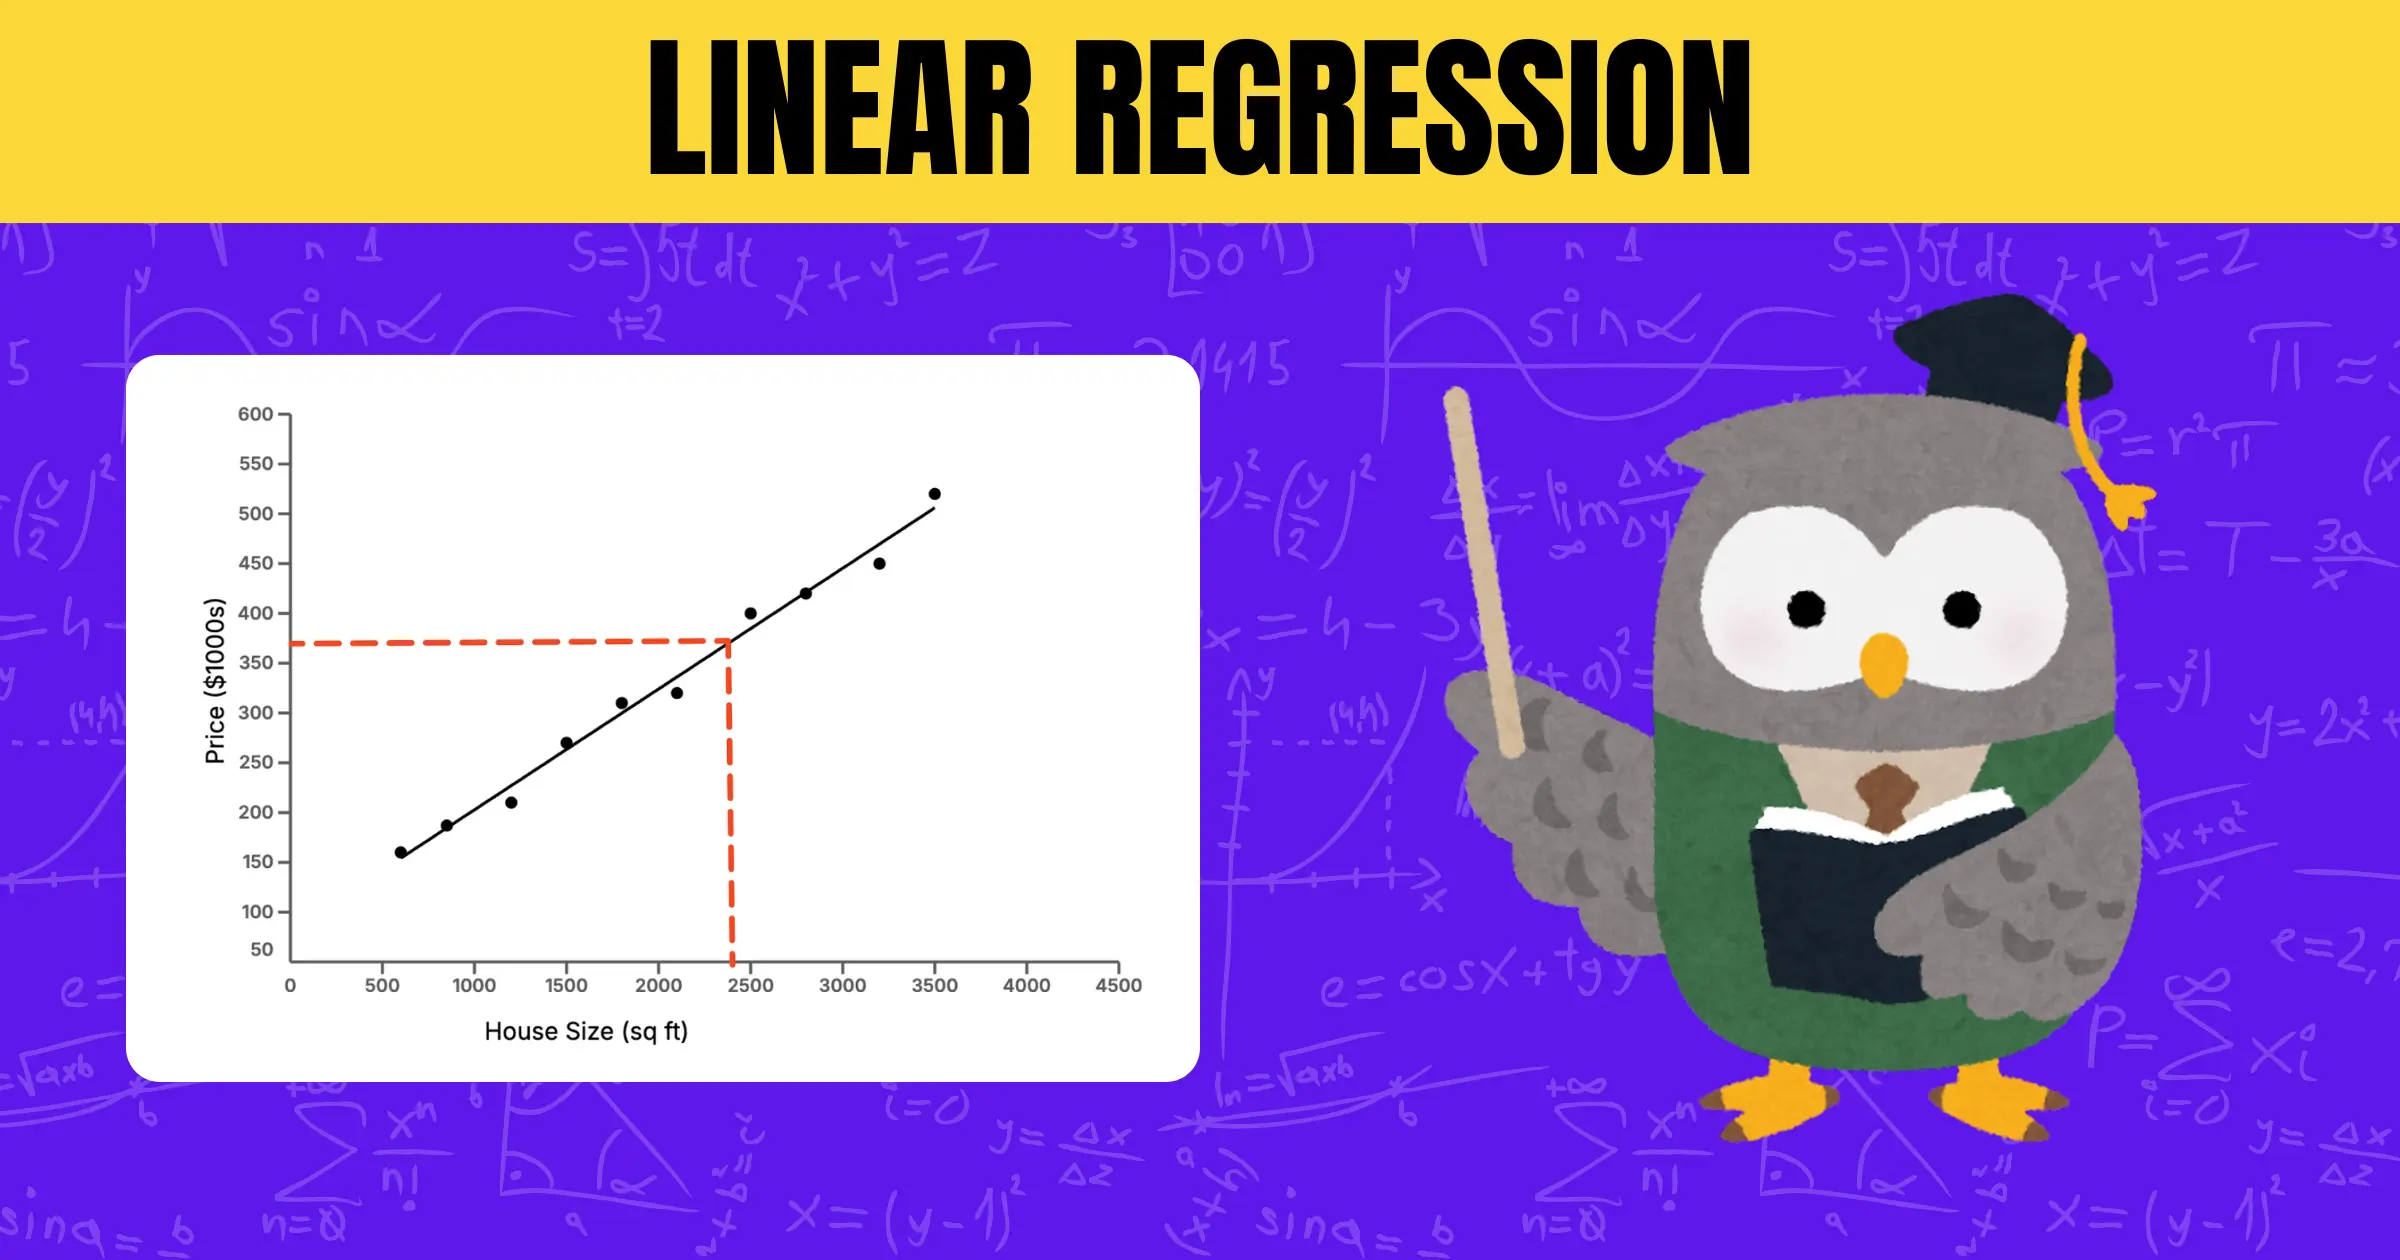
Today, we’re going to focus on regression, especially one of its most common forms, which is known as linear regression.
What is Regression ?
Regression is used when we want to predict a continuous numerical value. For example, predicting the price of a house based on its size, or estimating a person’s salary based on their years of experience.
There are several types of regression models, each suited for different kinds of data and relationships. However, the two most commonly used types are linear regression and non-linear regression.
- Linear Regression
Linear regression assumes a straight-line relationship between the input variables (also known as features) and the output variable (also known as the target). It’s a simple and widely used technique for making predictions when the relationship between inputs and outputs is roughly linear. - Non-Linear Regression
Non-linear regression is used when the relationship between the input variables (features) and the output variable (target) cannot be represented by a straight line. In such cases, the data may follow curves or more complex patterns that require advanced mathematical models to accurately describe the relationship.
Among linear regression and non-linear regression, in this article we will focus specifically on linear regression
What is Linear Regression ?
Linear regression is one of the simplest and most widely used techniques in machine learning and statistics. It helps us understand the relationship between one or more input variables (also called features) and a single output variable (also known as the target). The key idea behind linear regression is to find a straight-line relationship between the input and output. This means that as the input variable increases or decreases, the output variable changes in a consistent, linear way.
In simple terms, linear regression fits a straight line through a set of data points in such a way that the line best represents the trend in the data. This straight line is known as the line of best fit.
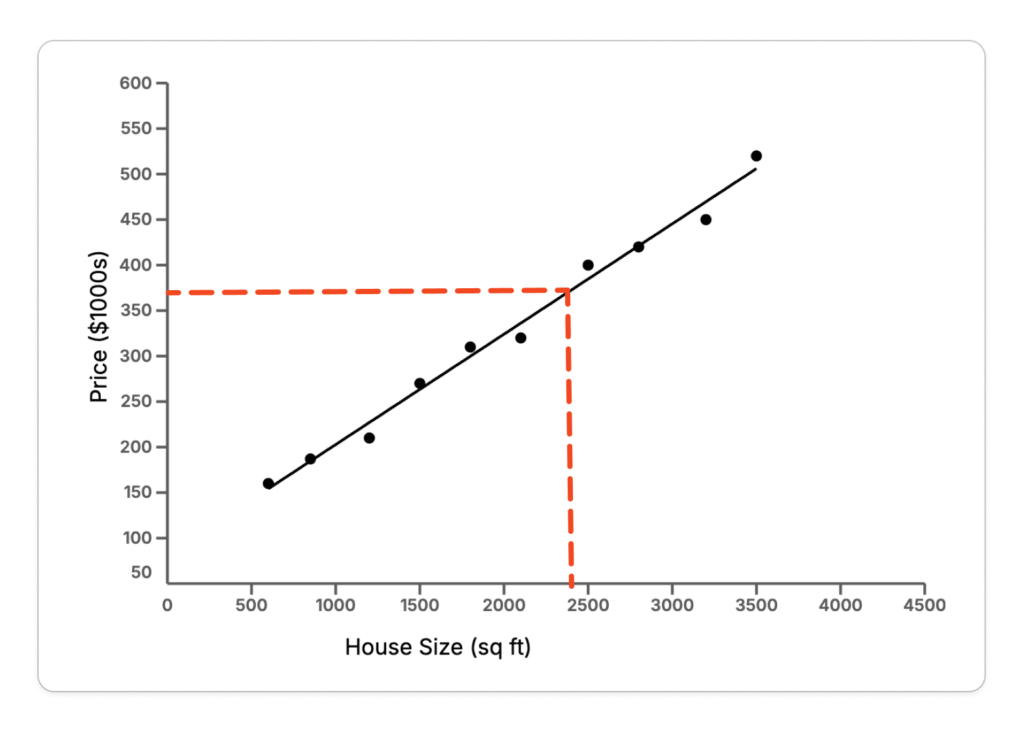
Imagine, you are trying to predict house price based on their size.
- You start by collecting data — a list of house sizes along with their corresponding prices.
- Next, you plot the collected data on a graph (see the graph above), where house size is on the x-axis and price is on the y-axis.
- Then, you draw a straight line, known as the line of best fit, which assumes a relationship between the input (house size or feature) and the output (price or target).
Here’s where the beauty of linear regression comes in. Imagine someone wants to know the estimated price of a house that is 2,400 square feet. Even if you don’t have that exact data point in your dataset, you can use the best fit line to predict the price based on the trend in your existing data.
Why Is It Called the “Line of Best Fit”?
The term “line of best fit” refers to how well the straight line represents the overall pattern of the data points. In other words, it’s the line that best captures the relationship between the input and output values.
When you have a set of data points on a graph, not all of them will fall perfectly on a straight line. Some will be a little above, and some a little below. The goal of linear regression is to draw a line that is as close as possible to all of these points, reducing the overall error in prediction.
To do this, linear regression uses a mathematical technique called the least squares method. This method calculates the distance between each actual data point and the predicted value on the line — specifically, the vertical distance between them. It then squares each of these distances (to make sure negative and positive errors don’t cancel each other out) and adds them all together.
The best fit line is the one that minimizes this total squared distance. That’s why it’s called the line of best fit — because it’s the line that produces the smallest possible overall error across all the data points.
Conclusion
Linear regression is a foundational concept in both statistics and machine learning. It offers a simple yet powerful way to understand and predict relationships between variables using a straight line. Whether you’re estimating house prices, predicting sales, or analyzing trends, linear regression provides a solid starting point for building predictive models.
In this article, we explored what regression is, how linear regression works, and why the line of best fit plays such an important role in modeling data. While real-world data can often be more complex and require advanced techniques, mastering linear regression is an essential first step for anyone beginning their journey into data science or machine learning.
In the next article, we’ll take a closer look at how the line of best fit is calculated mathematically.
Stay curious, and keep learning!